Are you looking to optimize your trading skills and improve the way you analyze markets? Then, maybe it’s time for you to consider using Ichimoku charts! These charts are adaptable technical analysis indicators that combine many components shown by separate indicators. After decades of work, it was first published in 1969, thanks to the efforts of Japanese journalist Goichi Hosoda.
It’s an easy-to-use technical indicator widely used by experts and traders to make profitable trades on platforms like Oanda. This article explores what Ichimoku Charts are, how they work, and their incredible advantages over traditional charting techniques.
Understanding the Ichimoku chart

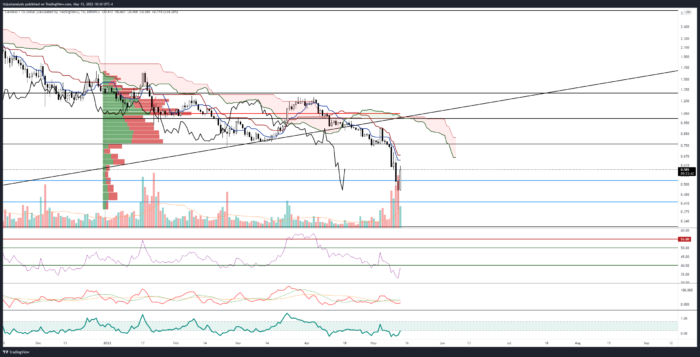
The chart is made up of five separate lines that provide an overview of the price activity, two of which create a shaded region known as the Ichimoku Cloud. Understanding the significance of each line and how they function inside the Ichimoku framework is essential for making sense of the indicator’s central. Understanding the significance of each line and how they function inside the Ichimoku framework is essential for making sense of the indicator.
One advantage of the Ichimoku chart is that it gives indications that would otherwise need the use of many indicators simultaneously. In addition, it’s laid out in a manner that makes it easy to decipher data like trend direction, support and resistance, and momentum. It is useful for gaining insight into the characteristics of the price via several data points since the indicator provides multiple pieces of information. As a result, the indicator may make a chart seem cluttered because of its various lines and zones. However, after you learn what the various parts of the Ichimoku Cloud indicator signify, you’ll find that it’s not as complicated as it seems.
How to read the Ichimoku ?

Each indication (component) of the Ichimoku indicator is constructed to reflect a unique facet of the price activity. On the chart, there are five lines and a colored region that symbolizes the cloud. There is a systematic calculation behind each line, and they all represent different characteristics of the indicator. Here are the lines:
- The Conversion Line (Tenkan-Sen) is the average of the high and low over the previous 9 periods.
Conversion Line = 9-period high + 9-period low / 2
- The Base Line (Kijun-Sen) is the longer-term reference line, and it is found by averaging the high and low of the previous 26 periods.
Base Line= (26-period high + 26-period low / 2)
- The Lagging Span, also known as the Chickou Span, is a lagging line that shows the average closing price over the preceding 26-time intervals. Using this line, you can see how recent price changes stack up against the last 26 time intervals.
- The Leading Span A, also known as the Senkou Span A, is a leading indicator specified for 26 periods.
Leading Span A = Conversion Line + Base Line / 2
- The Leading Span B (Senkou Span B) is also a leading indicator because it is computed for 26 periods in the future and is based on the mean of the 52-period high and 52-period low.
Leading Span B= 52-period high – 52-period low / 2
- One of the most eye-catching aspects of this chart is the Ichimoku Cloud (Kumo), denoted by the region bounded by the Leading Span A and Leading Span B lines. You can identify a potential indication by comparing the current price to the Ichimoku Cloud.
- Buyers have the upper hand when the price is above the Ichimoku Cloud.
- When the price drops below the cloud, a downward trend is likely.
- The presence of a price within the cloud suggests a flat trend.
- The leading span line’s motion causes the clouds’ colors to shift. For example, if Leading Span A is higher than Leading Span B, the surrounding region will be colored green. This configuration may be altered in the indicator’s parameters to suit your trading style better.
How to use the Ichimoku chart indicator?

Since it can determine prospective trend direction and momentum, the Ichimoku trading system can provide signals for potential buy and sell indications. In addition, stop-loss points, which may be set at the support level, can be helpfully defined using the Ichimoku indicator. Traders often rely on the Ichimoku Cloud because it gives a reliable forecast of the market’s likely direction. You may use the Ichimoku Cloud indicator for the following purposes in your trading strategy:
Define trend direction
The Conversion and Base Lines signals may be used to help you determine the direction of the trend. A rising trend is expected after the Conversion Line rises over the Base Line. The reverse or downward trend is anticipated if the Base Line rises over the Conversion Line.
Determine Support and resistance levels
The Leading Span A and B Lines, which define the boundaries of the Ichimoku Cloud, are used to determine areas of support and resistance. In addition to providing price forecasts, the Ichimoku Cloud indicator’s cloud edges may provide a glimpse of where support and resistance are likely to form.
Understand crossovers
The Base Line, and the Conversion Line are monitored for crossings. Keep in mind that the power of the crossover depends on where exactly it occurs. The strength of the signal is affected by the location of the crossover relative to the cloud, which might be either below, inside, or above.


