
Were you tasked with drawing a flowchart? If so, you might be feeling a little bit overwhelmed and stressed out – however, you are not alone. Most of us have no idea how to deal with flowcharts, especially if you are a beginner with less experience and knowledge. Well, the first thing you should know is that these charts can help people understand the flow of data in one system.
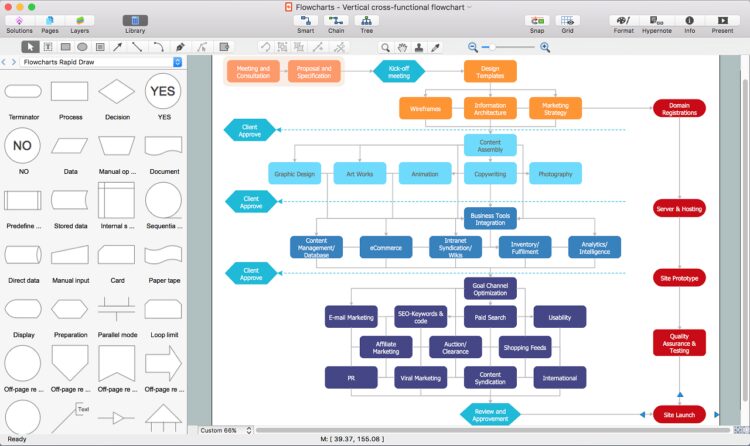
If the chart is not properly created, then it might easily mislead people or it might result in consequences that are not that good. Hence, if you were tasked with drawing one, you need to do it with caution and properly. And, if you do not know where to begin, do not worry, this article can help. Let’s take a look at some tips that can help you properly draw a flowchart:
So, How Can You Draw It?
There are various guidelines that you should follow, including:
1. First Things First, Learn And Understand The Basic Elements
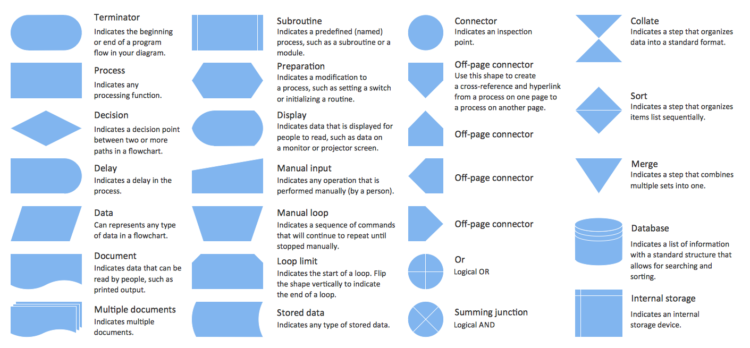
The first thing you should know is there are more symbols and boxes than just the basic ones such as processes and decision boxes. The most commonly used box is the rectangle that can represent either a task, operation, or process. The next one is, of course, a diamond, that is used for showing a decision.
There are other boxes as well, that can represent the data, documents, direct data, internal storage, manual input, and so on. These symbols are usually available in all programs for creating flowcharts, however, some people use different boxes for showcasing different things. Also you can check Visme which is free online flowchart maker for professional flowcharts.
2. You Design Elements Should Be Consistent

The one thing that you should always keep in mind is that the lines, boxes, and text need to be consistent. For example, if you “start” box is an oval than the “end” one should also be an oval. If you choose a rectangle, then all the boxes need to be rectangles. Also, think about the distance between the boxes – it also needs to be the same.
By being consistent, you will get rid of all distractions, which means that you’ll make the flow easy to follow. Additionally, you should also think about the colors you choose. Specific processes like decision need to be in a different color. By being consistent, you can also show professionalism.
3. Everything Should Be On The Same Page
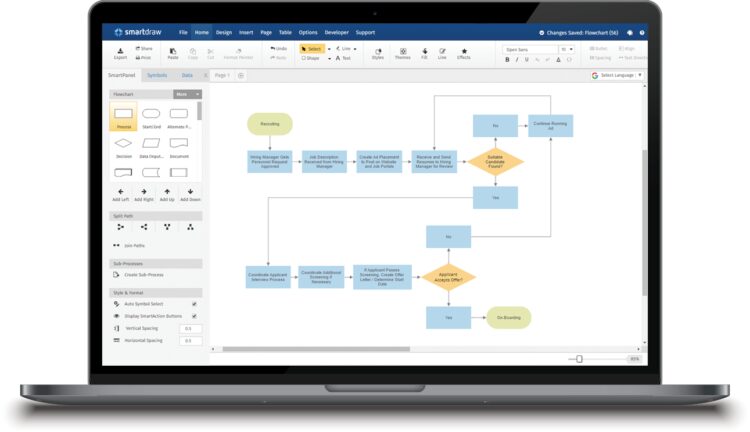
By keeping everything on one page, you will ensure that the text and chart remain distraction-free and readable. Now, if you need to create a diagram that is large, then you should think about splitting it into several ones and then connecting them with hyperlinks. You can try scaling it down, adjusting the font, as well as starting your chart from the left to right, then bringing it down and to the left, and so on.
Of course, if do not worry about adjusting everything, as well as everything fitting on one page, you can opt for using a program that will allow you to quickly create a flowchart. Hence, if you want to skip some of the tips mentioned above, you can check out zenflowchart.com to see what you can opt for.
4. ALWAYS Place The Return Lines Under The Diagram
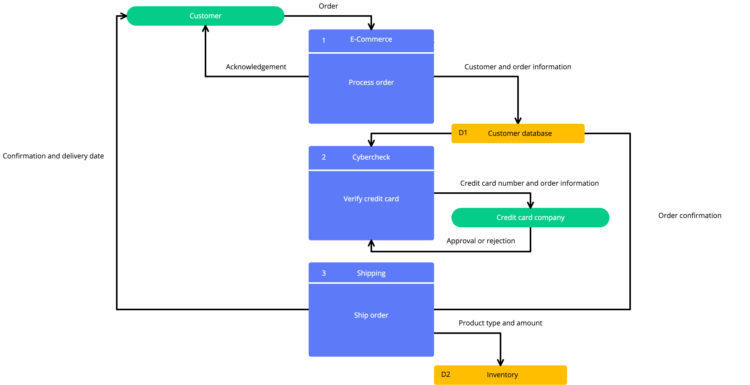
Generally, we read the text from the top to the bottom, hence, it is quite natural that the return lines are placed underneath the chart, instead of above. If you need to add two lines, they should NEVER, I repeat, never overlap. Just think about it, if they meet at some point, or if they overlap, people will not know what they are pointed at, which means that it can confuse people.
5. Larger or Bold Text Will Make a Box Stand Out
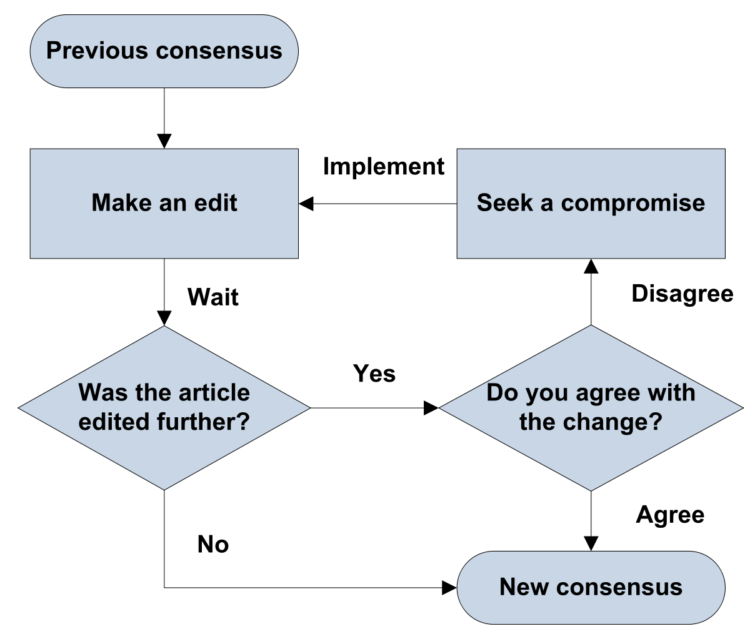
If there is a box or boxes that you want to emphasize, you should try using text that is larger and bold. Bigger letters will be attention-grabbing, and they will signify importance. An additional thing that you can do is to increase the thickness of the box borders, hence, it will basically demand more attention.
6. Let’s People Know What Each Box Means
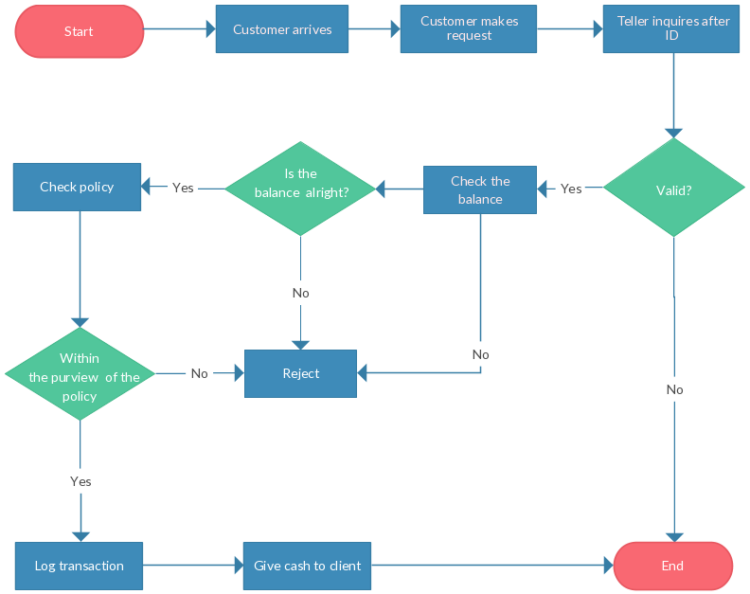
Of course, your chart can be entirely self-explanatory, however, other boxes and shapes might be a bit difficult to understand. So, what can you do in this situation? Well, you actually have two options. The first one requires you to make a shape and box template below. You can add it to the beginning of the chart, however, you can also opt for the second option.
The second option requires you to take the template and print it out. Hence, each person will have their own paper with an explanation of the shapes, so, you can make things easier for them and for you. Now, you can choose whatever option you want, it will help you.
7. Depending on The Program You Chose, You’ll Have a Lot of Power
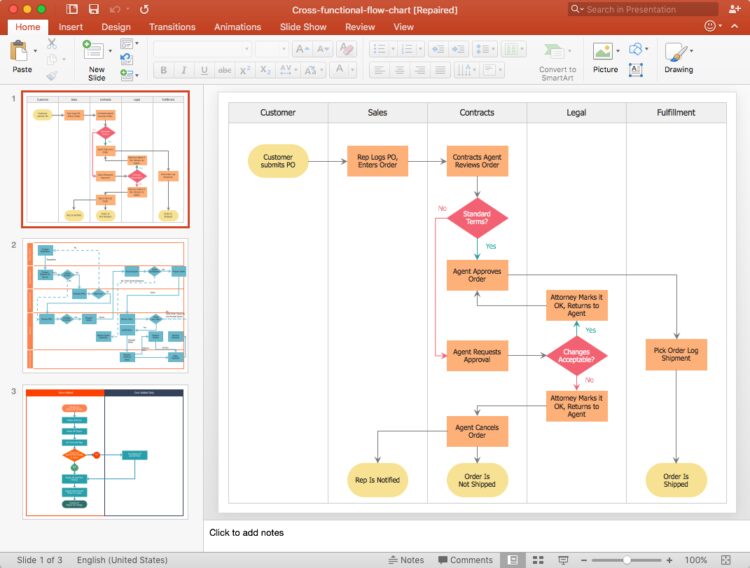
Once you have created your chart, you can easily print, publish, and export it to a wide range of other software including PowerPoint. Of course, this will depend on the program you choose, however, almost all of them have these options. Additionally, you can choose to save it in different image formats including JPG, SVG, and PNG.
8. Do Not Forget to Include Your Team And Colleagues

Creating a flowchart is a difficult process, which is why you should always include your team or/and coworkers that can help you with creating the diagram, as well as proofreading it. And, as previously mentioned, if not created properly, a flowchart can mislead and confuse people. Hence, always include other people in your project, or at least ask them to check the diagram with you.
Conclusion

By following the tips from the article, you will make the entire process of creating a flow chart easier, less time-consuming, and best of all, less overwhelming and stressful for you. So, now that you know what you should do, do not waste any more time. Instead, start thinking about how your flowchart will look like, as well as what it will contain.


